Know-Thy-Customer
Customer segmentation using K-means clustering and dimensionality reduction

Clever marketers understand that a company’s best customers are their existing customers. Offering tailor-made solutions to existing clients can strengthen the company’s relationship with a client by showing them that they ‘know’ them and ‘get’ what they are all about.
Customer Segmentation
Customer segmentation is used by marketing teams to sort customers into groups based on their demographics, behaviour, interests and/or location.
This divides users into similar or homogeneous groups that exhibit similar traits. Once these groups are known to the marketing team they can create products that speak to the specific needs of each group.
Machine Learning meets the Marketing Team
Machine learning provides the modern marketer with a number of algorithms, tools and techniques to analyse large amounts of data and reveal patterns, correlations, differences and similarities that might be hidden to the naked eye. Clustering algorithms belong to a family of unsupervised learning techniques that does just this.
In this project I will perform a customer segmentation on the Credit Card Dataset from the Kaggle website using clustering and dimensionality reduction techniques interchangeably.
A Look At The Data
The Credit Card Dataset is a summary of the usage patterns of around 9,000 customers collected by the bank (our client) over a 6 month period. The dataset measures 18 different features that describe each client and their interaction with their credit facility. More details on these features are available later in the notebook.
A quick look at the data dictionary reveals the following information about each feature in the dataset:
-
CUSTID : Identification of Credit Card holder (Categorical)
-
BALANCE : Balance amount left in their account to make purchases
-
BALANCE_FREQUENCY : How frequently the Balance is updated, score between 0 and 1 (1 = frequently updated, 0 = not frequently updated)
-
PURCHASES : Amount of purchases made from account
-
ONEOFF_PURCHASES : Maximum purchase amount done in one-go
-
INSTALLMENTS_PURCHASES : Amount of purchase done in installment
-
CASH_ADVANCE : Cash in advance given by the user
-
PURCHASES_FREQUENCY : How frequently the Purchases are being made, score between 0 and 1 (1 = frequently purchased, 0 = not frequently purchased)
-
ONEOFF_PURCHASES_FREQUENCY : How frequently Purchases are happening in one-go (1 = frequently purchased, 0 = not frequently purchased)
-
PURCHASES_INSTALLMENTS_FREQUENCY : How frequently purchases in installments are being done (1 = frequently done, 0 = not frequently done)
-
CASH_ADVANCE_FREQUENCY : How frequently the cash in advance being paid
-
CASH_ADVANCE_TRX : Number of Transactions made with “Cash in Advanced”
-
PURCHASES_TRX : Numbe of purchase transactions made
-
CREDIT_LIMIT : Limit of Credit Card for user
-
PAYMENTS : Amount of Payment done by user
-
MINIMUM_PAYMENTS : Minimum amount of payments made by user
-
PRC_FULL_PAYMENT : Percentage of full payments paid by user
-
TENURE : Tenure of credit card service for user
Data Source: https://www.kaggle.com/arjunbhasin2013/ccdata
Methodology Overview
I will attempt three different approaches to clustering the data and compare the outputs to get to the ideal customer clusters. The first will be a clustering on the full feature dataset. In the second and third approaches I will perform dimension reduction using an autoencoders and a RFM analysis and then apply unsupervised clustering on the reduced dataset.
Definitions
Clustering
Clustering is a method of unsupervised learning that finds similarities and patterns in data points and groups them together accordingly. This is done without prior knowledge of the data features.
K-Means
K-means is one of the best known clustering algorithms in machine learning. It creates k homogeneous groups by minimising the Euclidian distance between the data points in a cluster. The number of clusters, k, must be provided as an argument.
K-means clustering does have 2 very important assumptions that can easily ruin your analysis if not taken into account. These assumptions are:
- Clusters are spatially grouped or spherical
- Clusters are of similar size
Dimensionality Reduction
Real life datasets often contain huge numbers of features. This might make it complicated to extract homogeneous groups from the data. There are several ways, automated and manual, that we can reduce the dimensions of the data to get a better handle on what cohorts exist within a dataset.
Principal Component Analysis
PCA is an unsupervised machine learning algorithm that performs dimensionality reduction while attempting at keeping the original information unchanged. PCA works by finding composites of features called components.
RFM Analysis
RFM Analysis is an easy and effective segmentation technique that divides types of data into recency, frequency and monetary data bundles and works out a score for each. Once the data is segmented this way, algorithms can be performed on the newly formed dataset. This technique combines knowledge of the data and the environment in which the data exists with the power of machine learning algorithms.
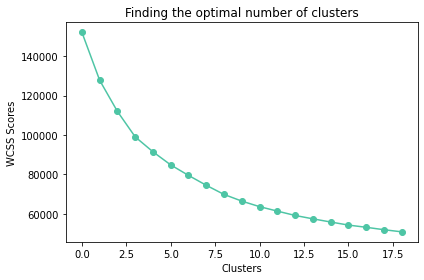
Method 1 : K-Means and the Elbow Method on Full Feature Set
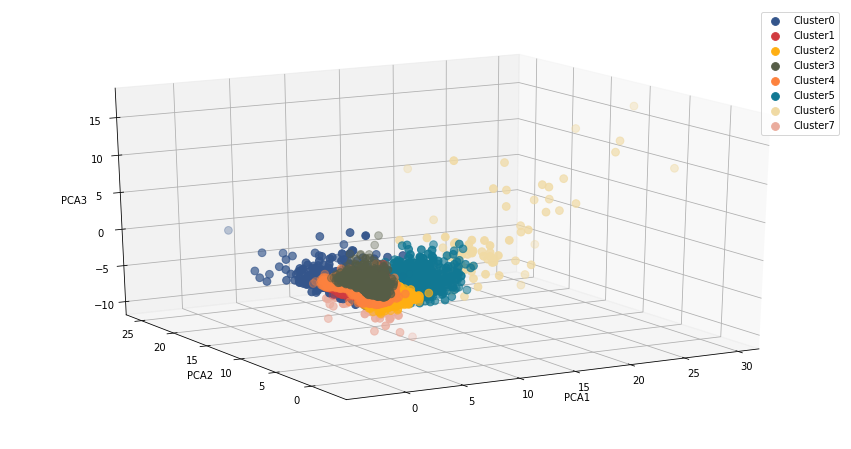
In this evaluation we ran K-means multiple times and plotting the wcss scores (within cluster sum of squares) to use the Elbow method. Optimal k for this method proved to be k=8 clusters.
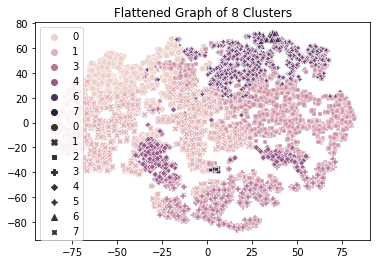
The cluster map shows a lot of overlapping between clusters as well as clusters that are dispersed across different areas. It does not really present us with a clear picture of where these dividing lines should be.
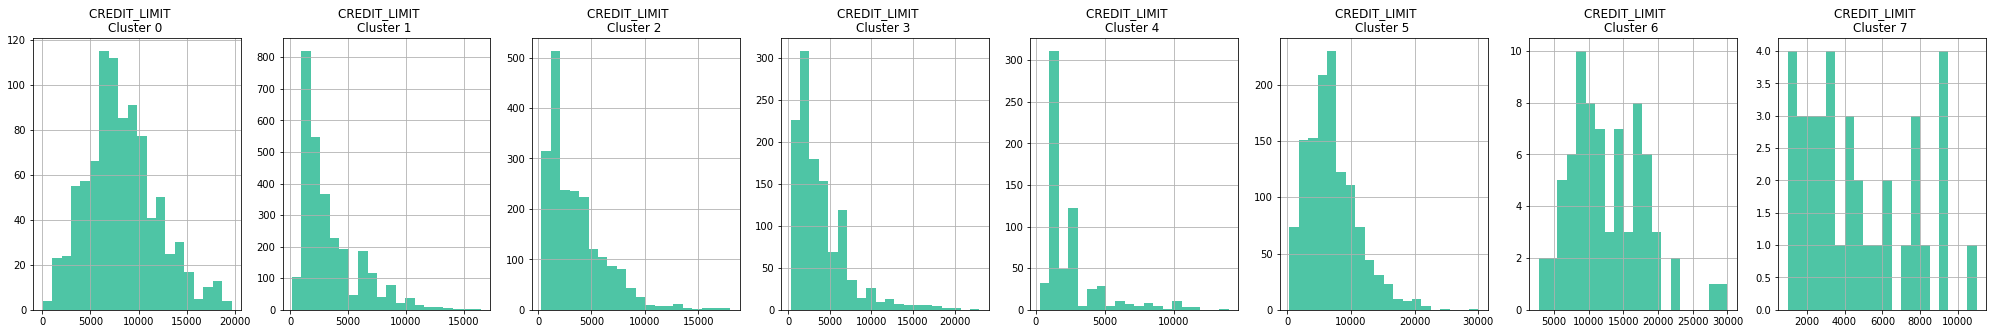
Looking at the features, for example the Credit Limit pictured above, we do see data that is more normally distributed but attempting to describe these clusters we find it difficult to form a picture of each group.
In the next method we will see if we can improve on this customer segmentation.
Method 2 : Autoencoders to reduce dimensionality and k-means to cluster the encoded features.
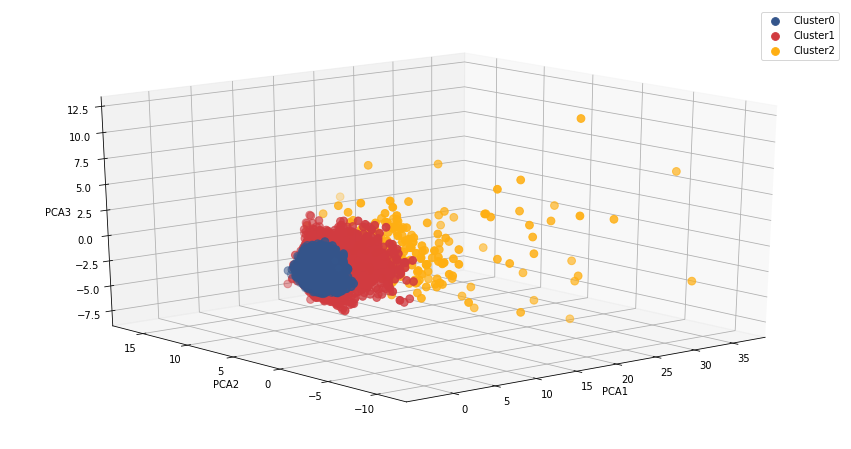
In this segmentation we built an Autoencoder artificial neural network to reduce the dimensionality of the dataset. Using the reduced dataset, we again ran K-means at different k-values and applying the Elbow method we discovered k=3 to be the optimal number of clusters.
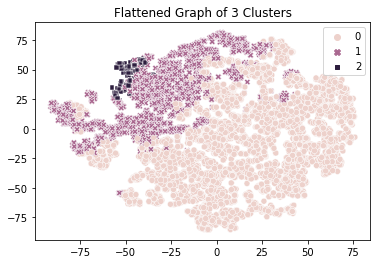
The result of our second method shows a tighter grouping and less scatter, and probably gives a result that is more in line with the expectation of the marketing team. As can be seen, one cluster is more dispersed that the other two.
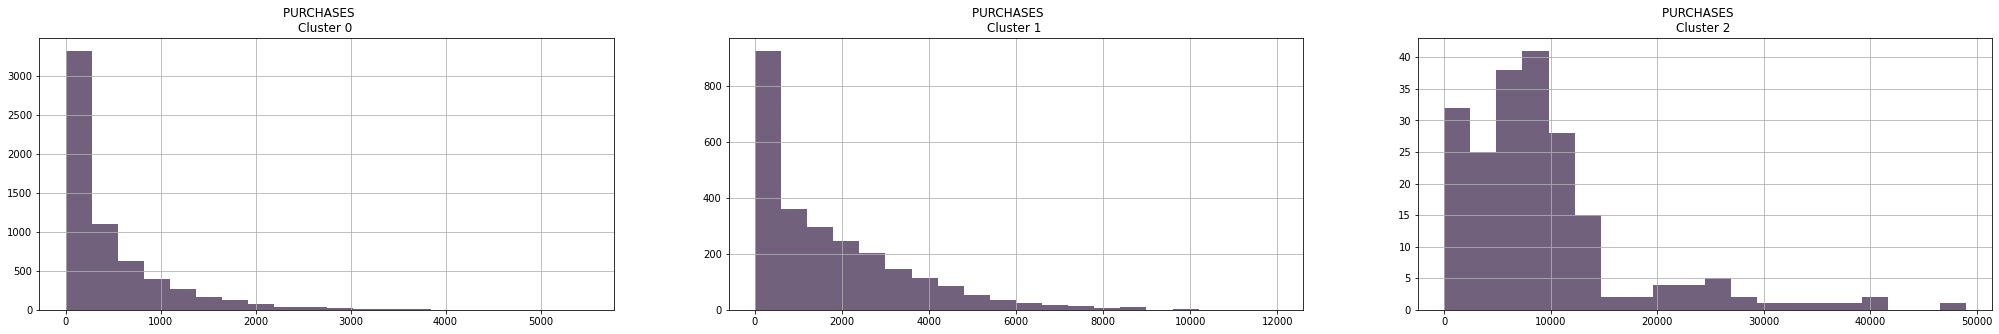
Visualising the features of each cluster we can se a clearer picture emerging than with the first method. This information should be tested against domain knowledge of the company’s domain expertise.
Method 3 : RFM Analysis
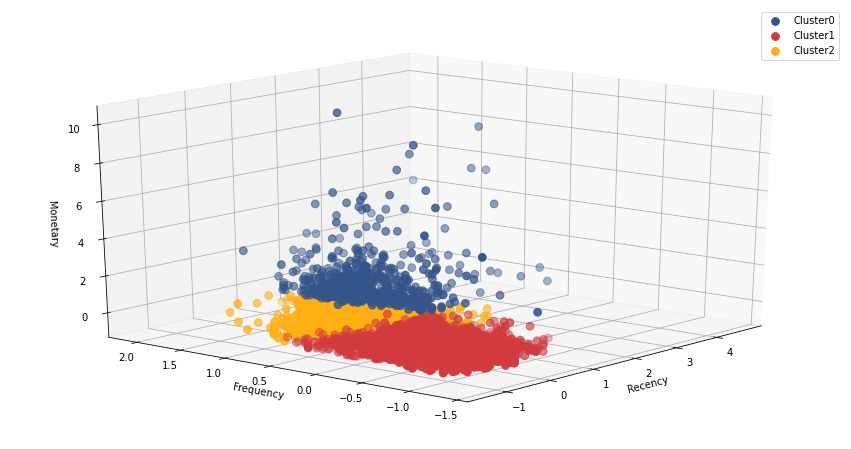
In Method 3 we performed a RFM Analysis (recency, frequency and monetary). Since our dataset does not have any transaction dates in it, we had to improvise and engineer features that simulate and/or represent recency. From the dataset description we learned that the data was gathered over a six month period, so it seems reasonable to use the number of times the clients transacted to represent this aspect of the analysis. I decided to keep the math simple and work out a basic mean with no special weights attributed to any of the features.
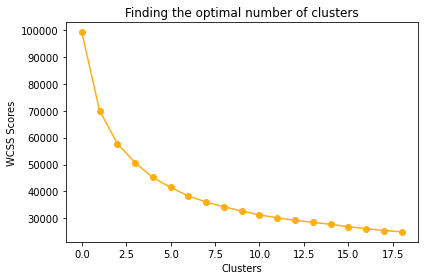
Following this we again ran K-means multiple times, obtained the WCSS scores (within cluster sum of squares) and using the Elbow method determined optimal k=3, similar to the second method.

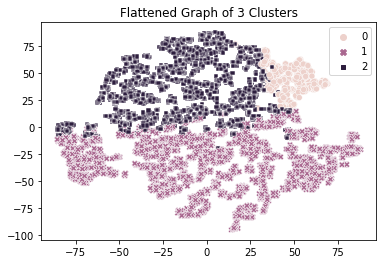 The resulting 3 clusters from the RFM analys confirms the results from method 2 that also eluded to 3 distinct groups of clients in the dataset.
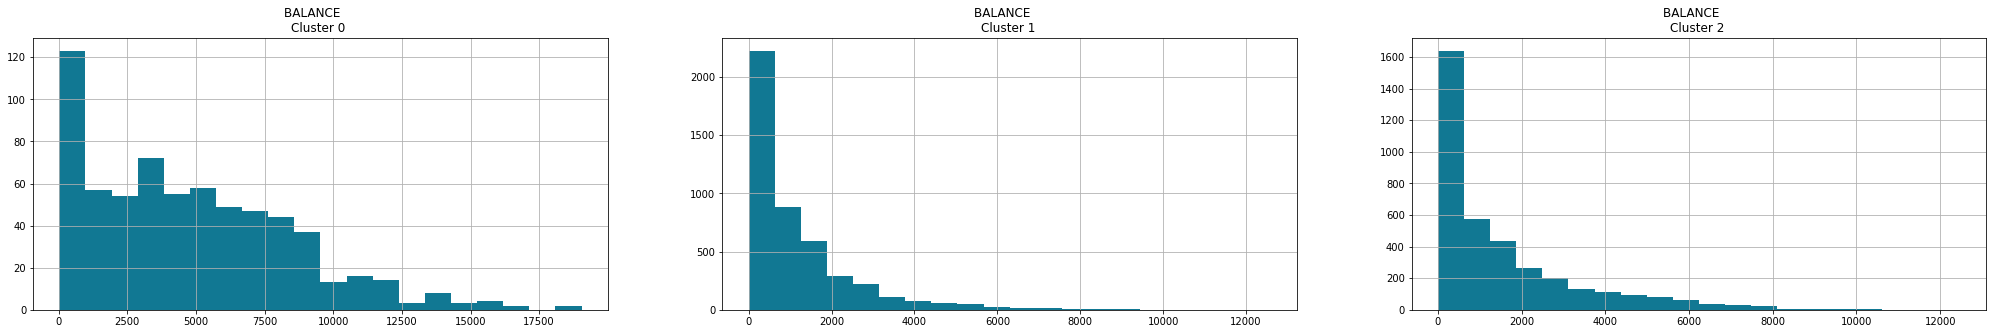
Visualising the features of each group, we end up with three very similar groups when compared to method 2. The scrutiny of experienced marketers will be the deciding factor in which method would be the best to use.
Comparing the 3 methods
Method 1 : K-Means
Method 2 : Autoencoders and K-Means
Method 3 : RFM Analysis
Comparing the clusters from each of the three methods, it seems that theoretically speaking, the RFM analysis yielded the best results. The clusters seems tighter and more evenly sized.
Conclusion
Clustering on it’s own can be an exceptionally valuable tool but its true power will be shown when it is coupled with extensive domain knowledge of the company and its products and insights, knowledge and understanding of the market, the company and its products.
Shout-outs and References
This project was inspired by a notebook from a Udemy courses by respected Prof Ryan Ahmed Ph.D, MBA on clustering.
The dataset is not perfect for a RFM since it contains not dates. To solve the missing data problem for the RFM Analysis, I came across a comprehensive article written by JR Kreiger on customer segmentation and how to adapt less than perfect data for a RFM analysis. A huge shout-out for the article, lots of good references and linked code.
I was also able to glean helpful insights into the practical application of k-means clustering by reading through Burak Özen’s article on K-means and it’s limitations.